Current Status of the Physics-Dynamics Coupling in
the Hirlam Model
I. Martí nez Marco, INM
Toulouse 12-13 December 2002
Introduction
-
This note describes a partial second-order accurate approximation of the
physical parametrizations in the two-time-level semi-Lagrangianand semi-implicit
(2TLSLSI) version of the HIRLAM model.
-
The approximation is achieved by averaging all or part of the parameterization
tendencies along the semi-Lagrangian trajectory, following the ECMWF approach
(Wedi,1999).
-
The coupling of the physics to the dynamics in the HIRLAM model is described
and compared with the current operational configuration.
-
A "first-guess" predictor of the model variables is employed to achieve
the coupling of the different parametrization schemes to each other.This
predictor value tries to reduce the time-step dependency.
Coupling of parameterizations with the dynamics
The generic one-dimensional advection equation can be written as:
|
¶y(x,t)
¶t |
+ u(x,t) |
¶y(x,t)
¶x |
= L { y(x,t)
} + N { y(x,t) } |
|
(1) |
where y is a scalar field, u is the advecting
velocity and L and N represent the linear and nonlinear terms, respectively.
Following McDonald(1998), the 2TLSLSI method of discretization can be
expressed as:
| yn+1I
- yn* = |
Dt+
2 |
[ Ln+1 + Nn+[1/2]]I+ |
Dt-
2 |
[ Ln + Nn+[1/2]]* |
|
(2) |
where Nn+[1/2] = [((3 Nn
- Nn-1))/2]
and Dt±
= (1 ±eg) Dt
; eg is called the "decentering"
parameter (to reduce high-frecuency oscillations). For any field f
, fnI = f(I
Dx ,n Dt)
, and fn* = f(x*,
n Dt) . The subscripts I and *
denote, respectively, an evaluation at the arrival point and the departure
point of the trajectory. The superscript n denotes the number of time-step.
If physical parameterizations are also included and following the ECMWF
approach, the resulting equation is:
| yn+1I
- yn* = |
Dt+
2 |
[ Ln+1 + Nn+[1/2]
+ Pn+1]I+ |
Dt-
2 |
[ Ln + Nn+[1/2]
+ Pn]* |
|
(3) |
-
where one half of the tendency is computed at the arrival point and the
other half at the departure point of the trajectory. This approximation
is second-order accurate.
-
The current reference HIRLAM model makes use only of the parameterization
tendencies at the arrival point, being thus the time discretization only
first-order accurate for physical processes.
The Interface between the physics and dynamics
1) The first experiment DPW is very similar to the ECMWF approach
(Wedi,1999). The contributions of the radiation and convection schemes
are averaged along the semi-Lagrangian trajectory and those of the vertical
diffusion are taken at the arrival point only.
The final equation, once the tendencies of the parameterizations are
computed, is:
| yn+1I
- yn+1D
= |
Dt+
2 |
[ Pn+1rad+conv]I+ |
Dt-
2 |
[ Pnrad+conv]*
+ Dt+ Pn+1vdif,I |
|
(4) |
2) In the second one DPI, the radiation and convection tendencies
of the previous time-step and interpolated at the departure point are introduced
in the semi-implicit adjustment. This alternative implies that around half
of the physical tendencies are taken into account by the dynamical tendencies.
The discretized resulting equation is:
|
~
y
|
n+1
I |
- yn*
= |
Dt+
2 |
[ Ln+1 + Nn+[1/2]
]I+ |
Dt-
2 |
[ Ln + Nn+[1/2]
+ Pnrad+conv]* |
|
(5) |
And the final equation is:
| yn+1I
- |
~
y
|
n+1
I |
= |
Dt+
2 |
[ Pn+1rad+conv]I+
Dt+ Pn+1vdif,I |
|
(6) |
3) In the current reference HIRLAM model (experiment REF), the
contributions of the radiation, convection and vertical diffusion schemes
are taken at the arrival point only.
The final equation is:
| yn+1I
- yn+1D
= Dt+ [ Pn+1rad+conv+vdif]I |
|
(7) |
Coupling of the parameterization schemes
-
The HIRLAM model makes use of the "fractional stepping" approach (Beljaars,
1991). The results depend consequently on the calling sequence.
-
In the HIRLAM model this sequence is: first, radiation; second, soil processes;
third, vertical diffusion and, lastly, convection. The convection scheme,
therefore, uses the tendencies of the vertical diffusion and radiation
schemes. This calling sequence has been implemented recently.
-
To keep the idea of "fractional stepping", a "first guess" predictor of
the model variables is used.
-
In the experiments DPW and DPI, a "first guess" predictor
is employed by using the tendency from the dynamics, the tendency of the
radiation and convection at the previous time-step and the tendency of
the vertical diffusion at the current time-step (Wedi, 1999):
| yn+1predict
= yn+1D
+ aPn*,rad+conv
Dt + Pn+1I,vdif
Dt |
|
(8) |
where yn+1D
stands for the dynamical fields at the arrival point. The parameter a
= 0.5 has been introduced in order to achieve a better balance between
the physical parameterizations.
In the proposed schemes the parameterizations at the current time-step
are computed in the following calling sequence:
| Pn+1I
= Pn+1I,rad (yn)
+ Pn+1I,vdif (yn+1D)
+ Pn+1I,conv (yn+1predict) |
|
(9) |
The current reference HIRLAM model (experiment REF) uses "fractional
stepping" with the following calling sequence:
| yn+1predict
= yn+1D+Pn+1I,rad
Dt + Pn+1I,vdif
Dt |
|
(10) |
| Pn+1I
= Pn+1I,rad (yn)
+ Pn+1I,vdif (yn+1D)
+ Pn+1I,conv (yn+1predict) |
|
(11) |
-
Radiation and vertical diffusion schemes are left unchanged.
-
The main change is due to the use aPn*,rad+conv
instead of Pn+1I,rad
in the convection scheme. The contributions of the radiation scheme at
the current time-step are replaced by those of the radiation and convection
schemes at the previous time-step evaluated at the departure point of the
semi-Lagrangian trajectory.
Results
-
The experiments DPW and DPI are compared to REF.
-
HIRLAM version 5.2,
-
0.2ox0.2o resolution in the horizontal,
-
31 hybrid levels in the vertical and
-
326x125 points.
-
Mixed (Cubic/Linear) interpolation is used to interpolate the diabatic
tendencies P to the departure point of the semi-Lagrangian trajectory.
-
In the first time step, the configuration is similar to the reference HIRLAM
model.
Comparison of numerical accuracy
-
To examine the sensitivity of the solutions to changes in the length of
the time-step, we assume that the method which has the long time-step solution
closer to the short time-step solution is the better method (Wedi,1999).
-
Four different 24-hour forecasts have been run with t=120s and t=900s.
As a measure for the deviation of the 900s-solution from the assumed correct
120s-solution, the root mean square error has been computed for the three
experiments:
The overbar denotes an average over area. The variables F are the diabatic
tendencies integrated vertically and accumulated every time-step over a
period of 24 hours.
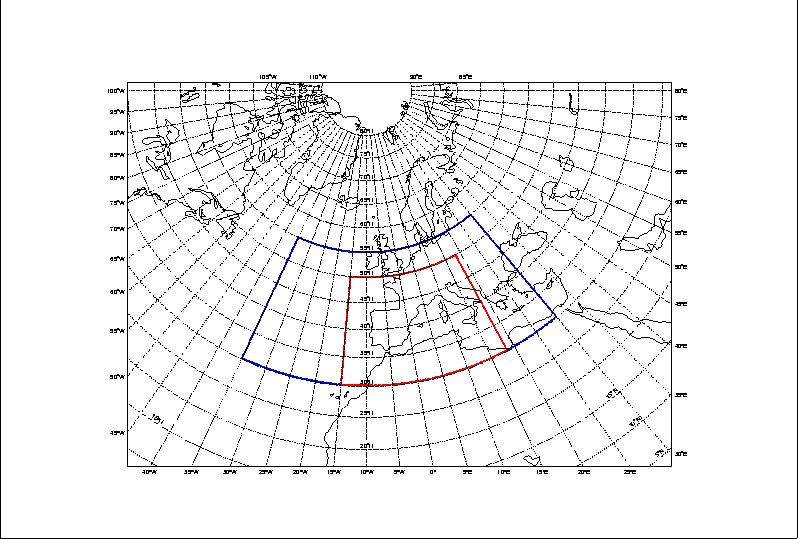
Figure 1: Domains used
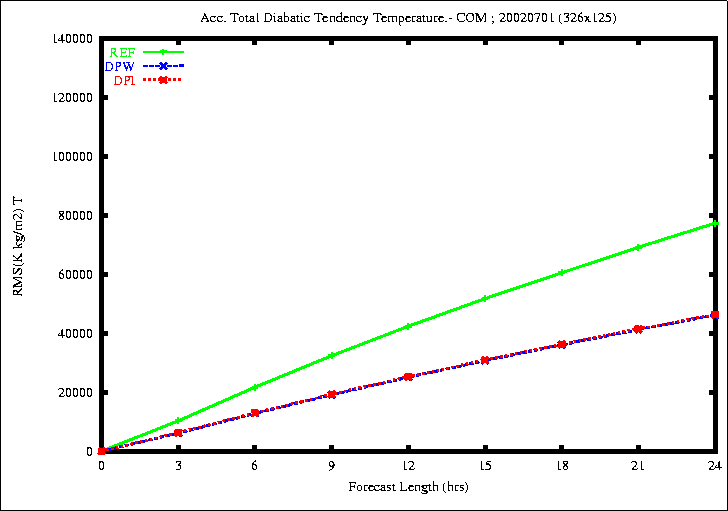
Figure 2: RMSE of the accumulated total diabatic tendency of temperature

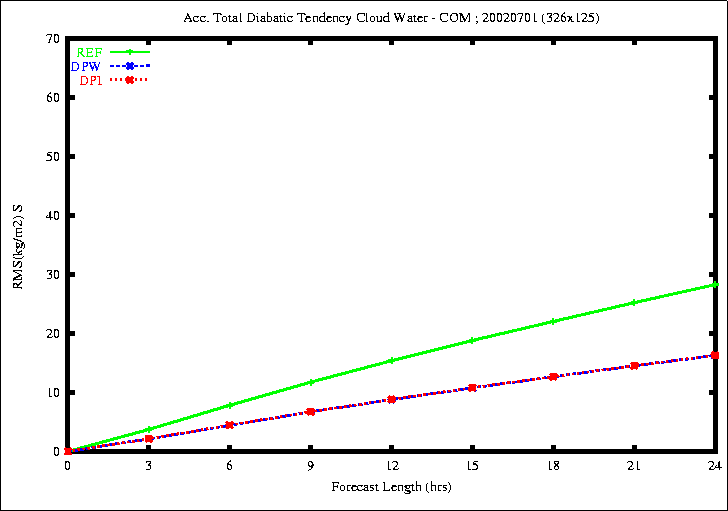
Figure 3: RMSE of the accumulated total diabatic tendency of Specific
Humidity (top) and Cloud Water Content (bottom)
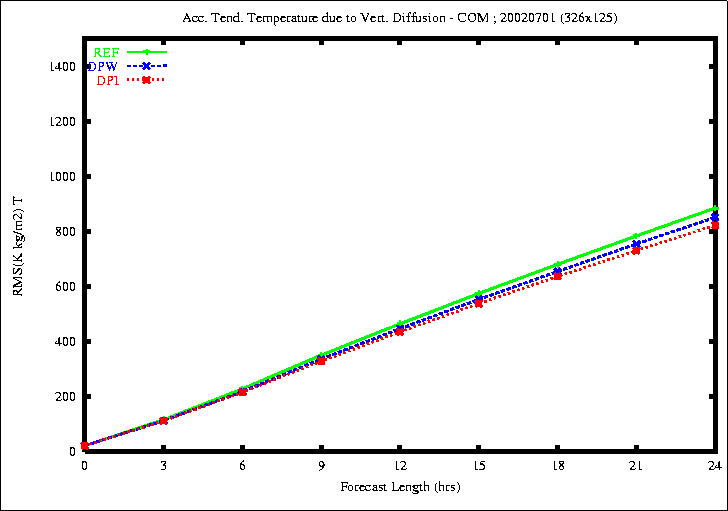
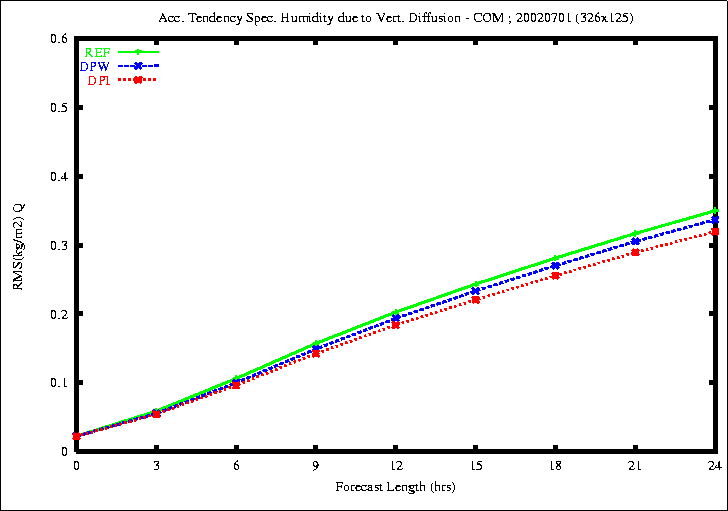
Figure 4: RMSE of the accumulated diabatic tendency of temperature (top)
and specific humidity due to Vert. Diffusion (bottom)
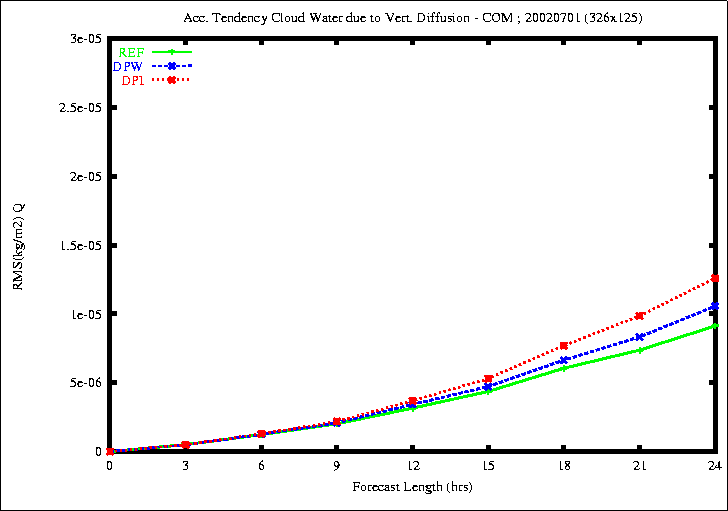
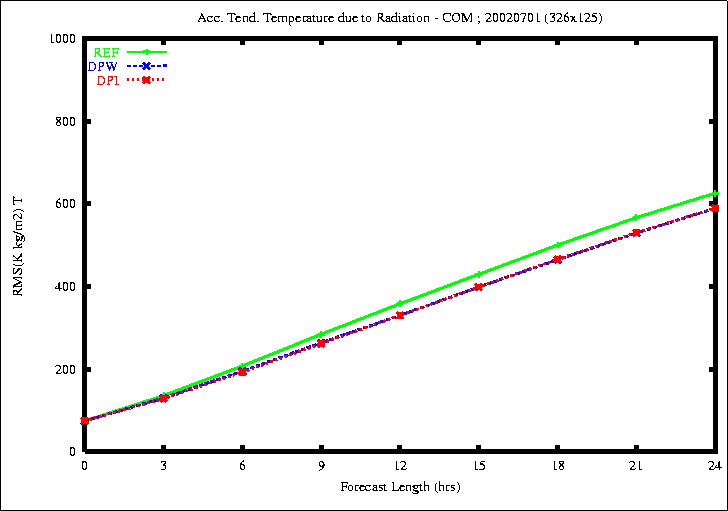
Figure 5: RMSE of the accumulated diabatic tendency of cloud water content
due to vert. diff. (top) and of temperature due to radiation (bottom)
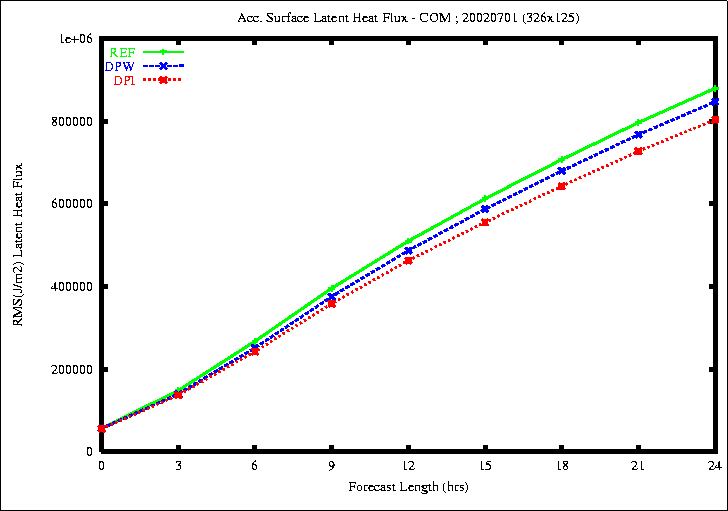
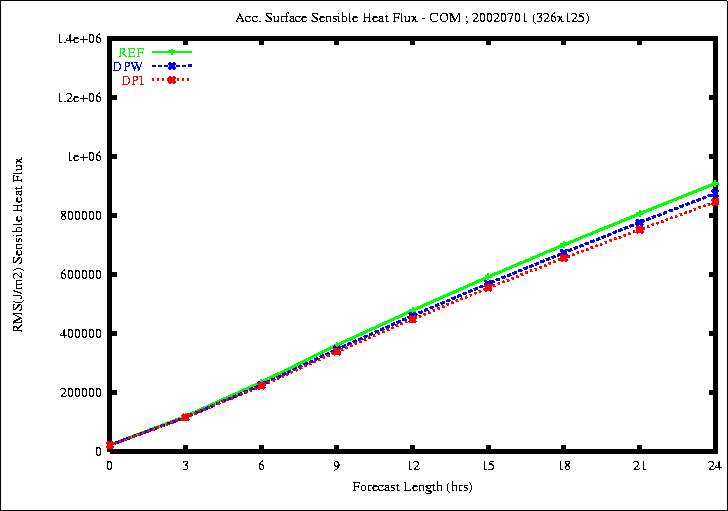
Figure 6: RMSE of the accumulated Surface Latent Flux (top) and Sensible
Flux (bottom)
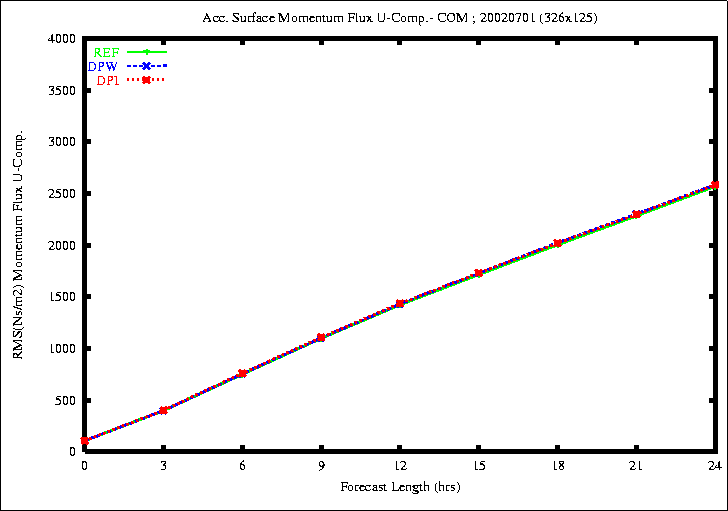
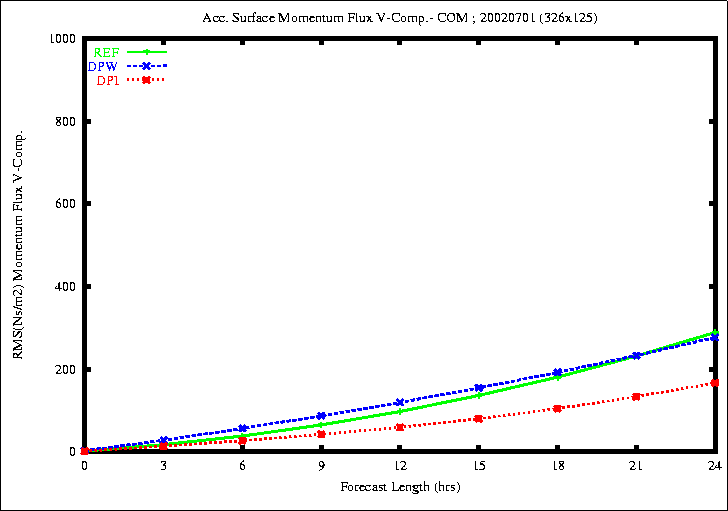
Figure 7: RMSE of the accumulated Momentum U Flux (top) and V Flux (bottom)
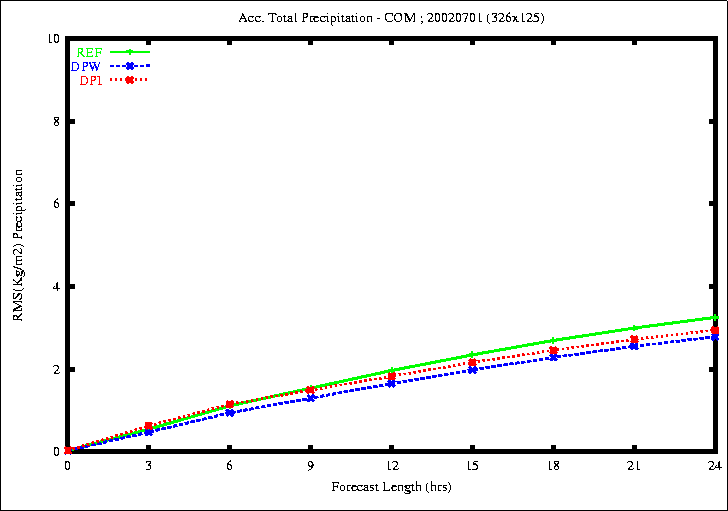
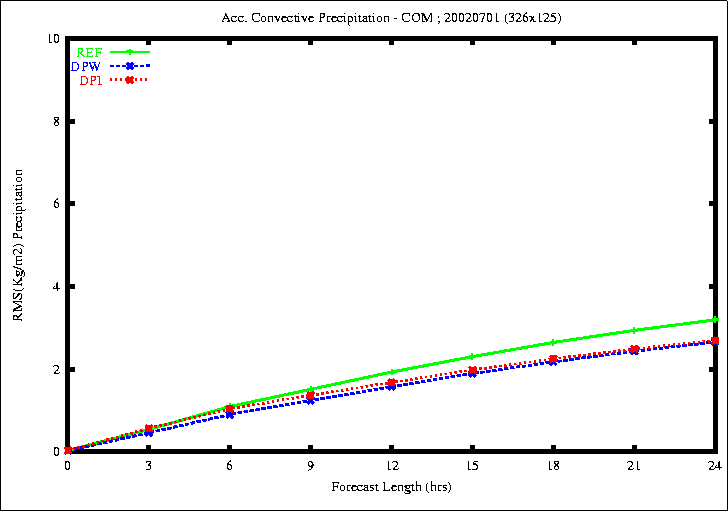
Figure 8: RMSE of the accumulated total Precipitation (top) and Convective
Precip. (bottom)
-
By comparing the three experiments REF, DPW and DPI,
I have found that:
-
the rmse of the total diabatic tendencies of temperature,specific
humidity and cloud water content is smaller with the experiments DPW
and DPI.
-
the rmse of the diabatic tendency of temperature due to Radiation
is smaller with the experiments DPW and DPI.
-
the rmse of the diabatic tendency of temperature due to Vertical
Diffusion is smaller with the experiment DPI.
-
the rmse of the diabatic tendency of specific humidity due to Vertical
Diffusion is smaller with the experiment DPI.
-
the rmse of the diabatic tendency of cloud water content due to
Vertical Diffusion is closer to zero and the results are contradictory.
-
the rmse of the surface latent and sensible fluxes is smaller with
the experiment DPI.
-
the rmse of the surface momentum U flux is similar in all experiments.
-
the rmse of the surface momentum V flux is smaller with the experiment
DPI.
-
the rmse of the total precipitation is smaller with the experiments
DPW and DPI.
-
the rmse of the convective precipitation is smaller with the experiments
DPW and DPI.
Verification scores against observations over the whole area (168x100 points)
have been carried out to compare the different schemes.
The integrations started in july 2002 from the 1st
at 12 UTC to the 15th at 12 UTC each 6 hours.
The variables studied are:
-
temperature,
-
relative humidity and
-
wind.
The results of the short time step solutions are very similar using either
method.
The errors for the long time-step solution are also similar but the
differences are bigger.
The better results of the new methods appear in the relative humidity
at upper levels.
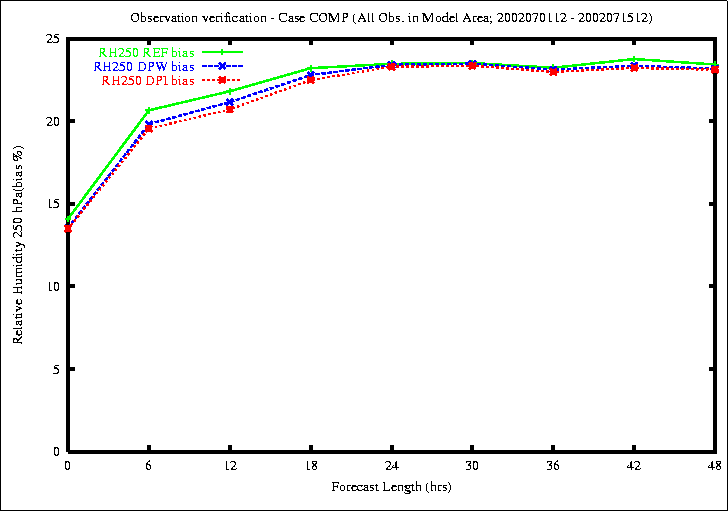
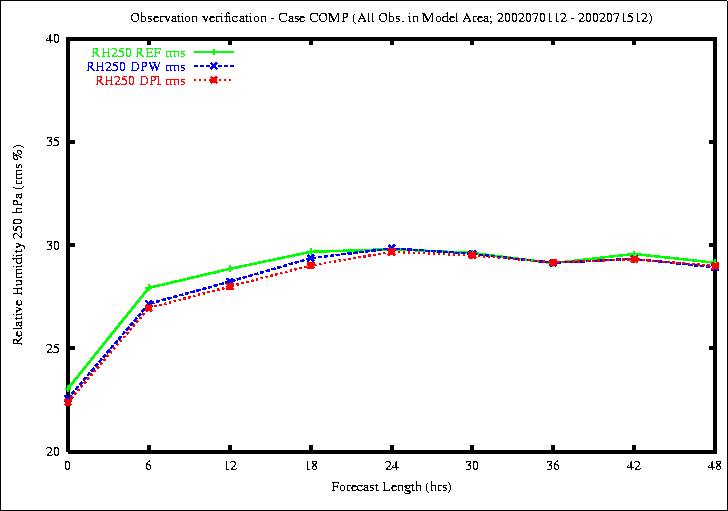
Figure 9: Bias (top) and RMS (bottom) of Relative Humidity in 250 hPa
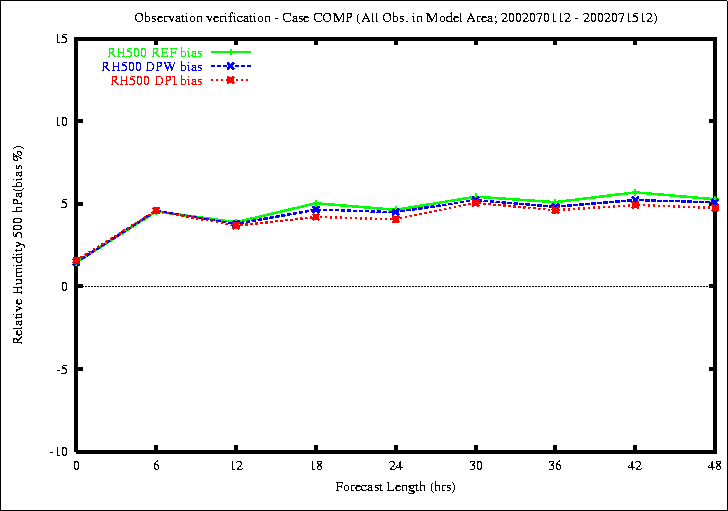
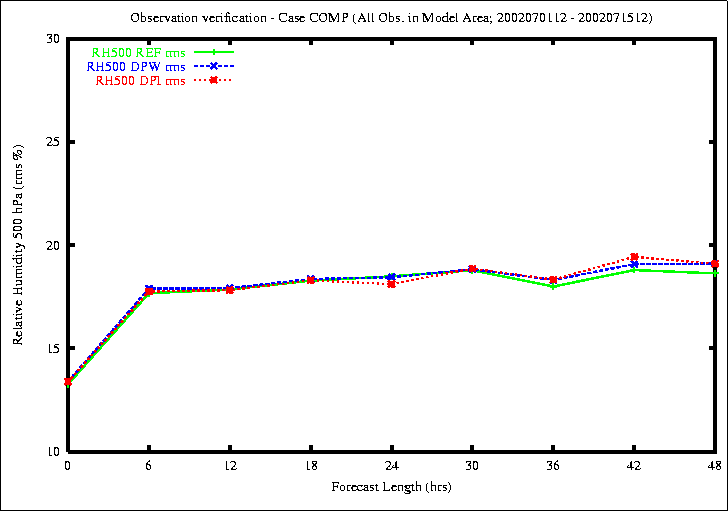
Figure 10: Bias (top) and RMS (bottom) of Relative Humidity in 500 hPa
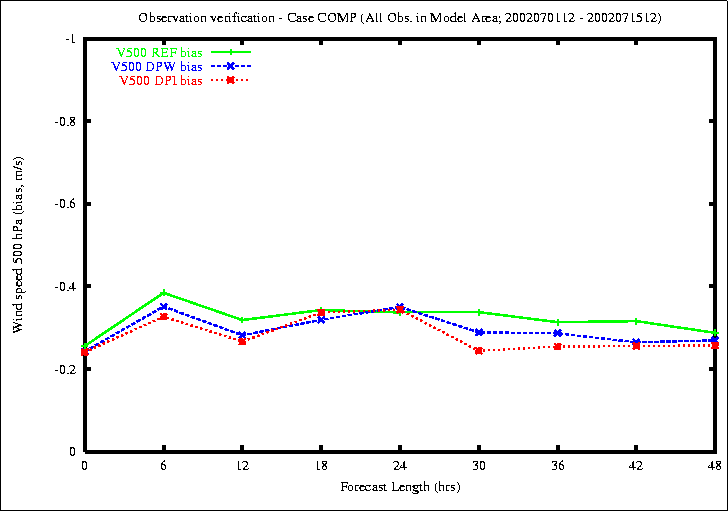
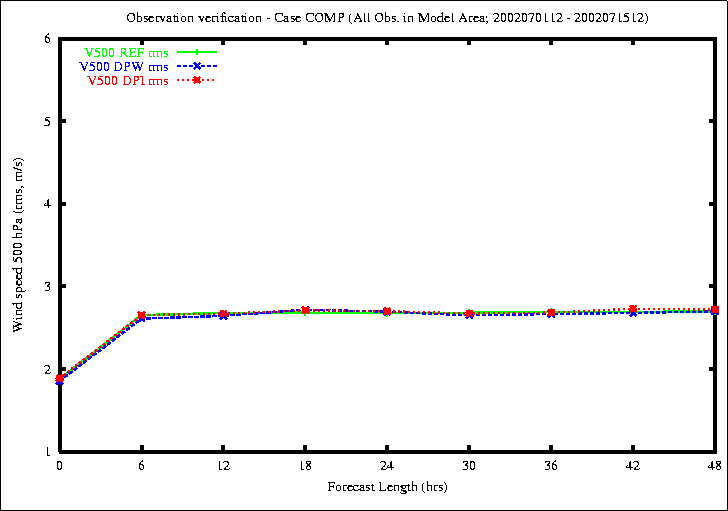
Figure 11: Bias (top) and RMS (bottom) of Wind in 500 hPa
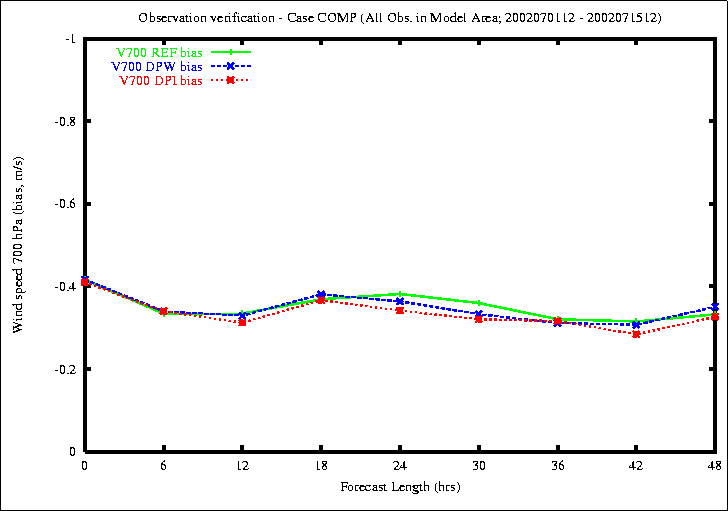
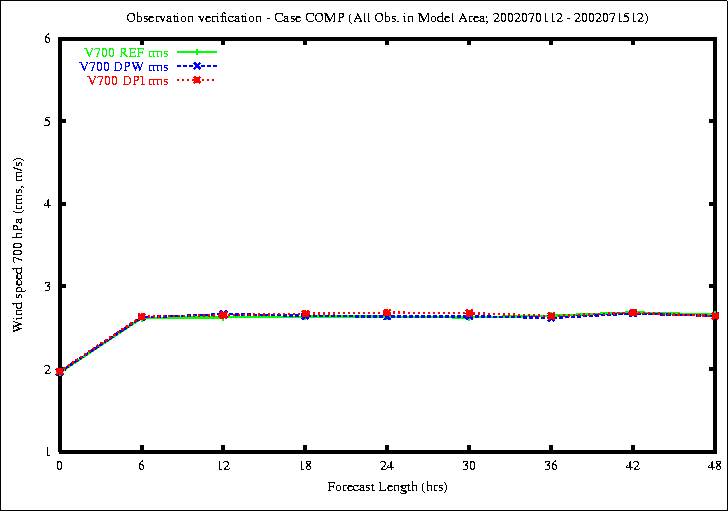
Figure 12: Bias (top) and RMS (bottom) of Wind in 700 hPa
Strong Convective Cases
Since the most important improvement is in the convection scheme, I
have studied two cases of strong convection.
The Storm of Central Europe
The general characteristics of the experiment are:
-
HIRLAM version 5.2,
-
326x175 points with a 0.2ox0.2o resolution
in the horizontal,
-
31 hybrid levels in the vertical,
-
a slightly bigger time step t=720s and
-
it was started at 1200 UTC 11.08_2002 up to H+48.
The results are compared to the reference HIRLAM model using a short time
step t=120s.
Strong Convection over the Mediterranean area
The general characteristics of the experiment are:
-
HIRLAM version 5.2,
-
168x100 points with a 0.2ox0.2o resolution
in the horizontal,
-
31 hybrid levels in the vertical,
-
a slightly bigger time step t=600s and
-
it was started at 0000 UTC 10.10.2001 up to H+36.
The results are compared to the image of satellite.
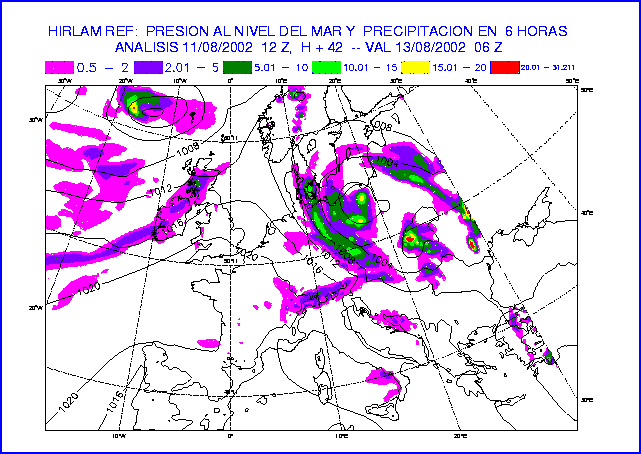
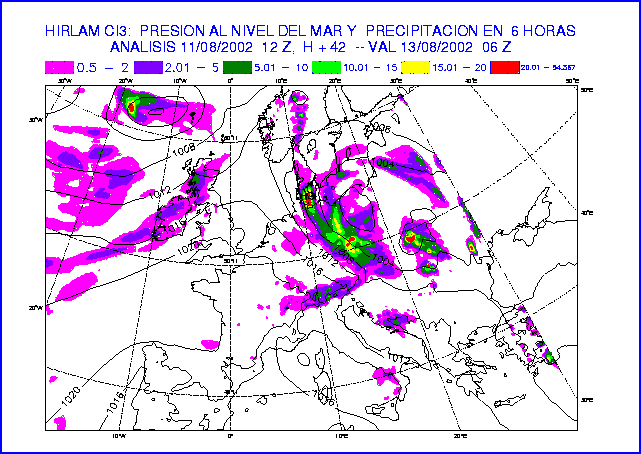
Figure 13: MSLP and 6-hour accumulated precipitation at 42-hour forecast
of the experiments REF t=720s (top) and REF t=120s (bottom).
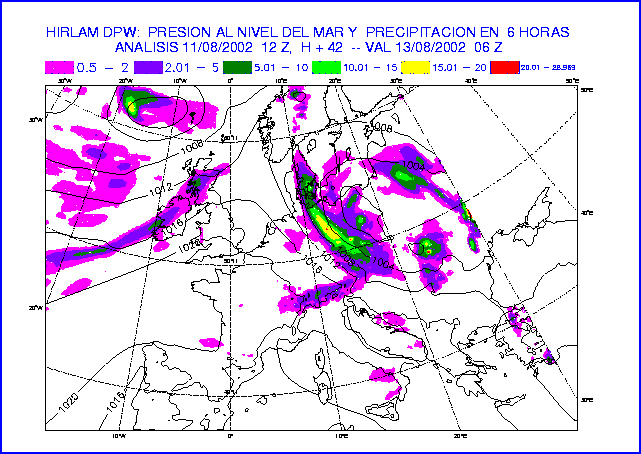
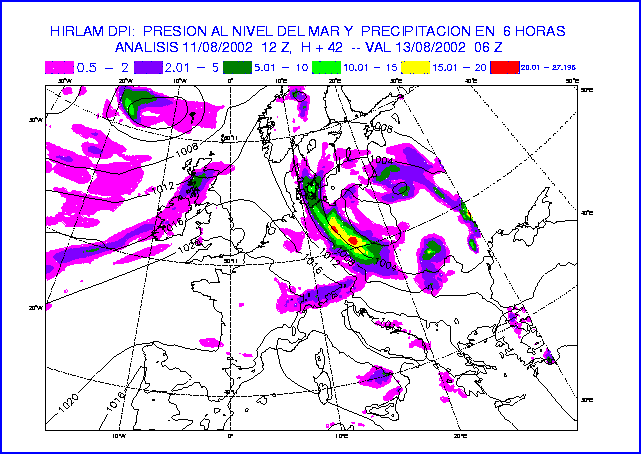
Figure 14: MSLP and 6-hour accumulated precipitation at 42-hour forecast
of the experiments DPW (top) and DPI (bottom).
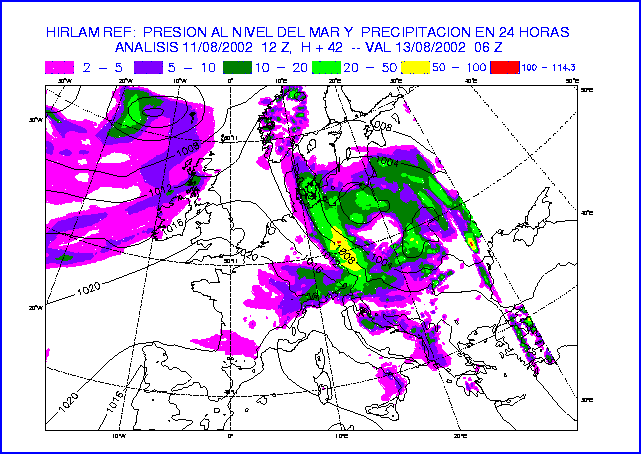
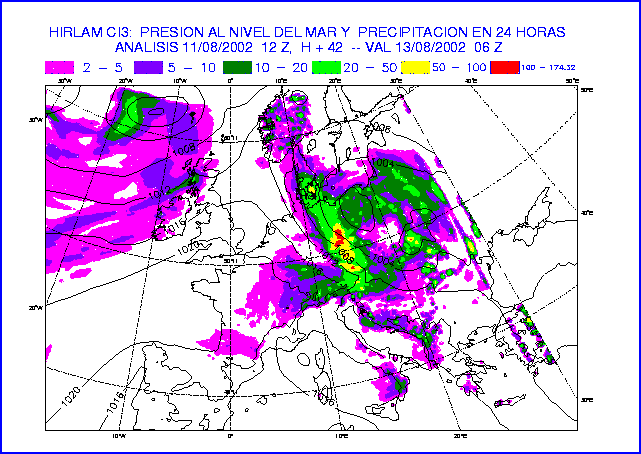
Figure 15: MSLP and 24-hour accumulated precipitation at 42-hour forecast
of the experiments REF t=720s (top) and REF t=120s (bottom).
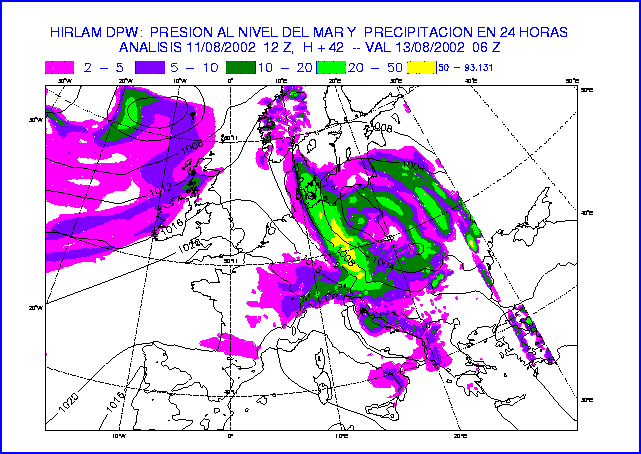
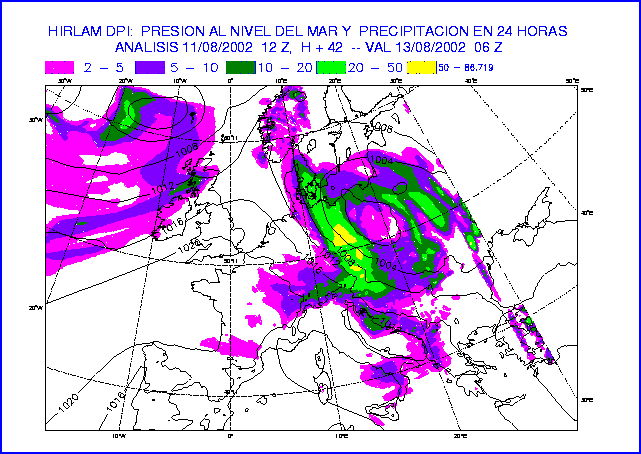
Figure 16: MSLP and 24-hour accumulated precipitation at 42-hour forecast
of the experiments DPW (top) and DPI (bottom).
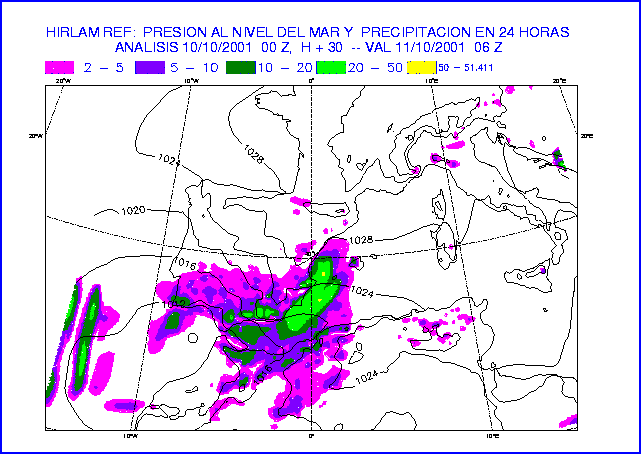
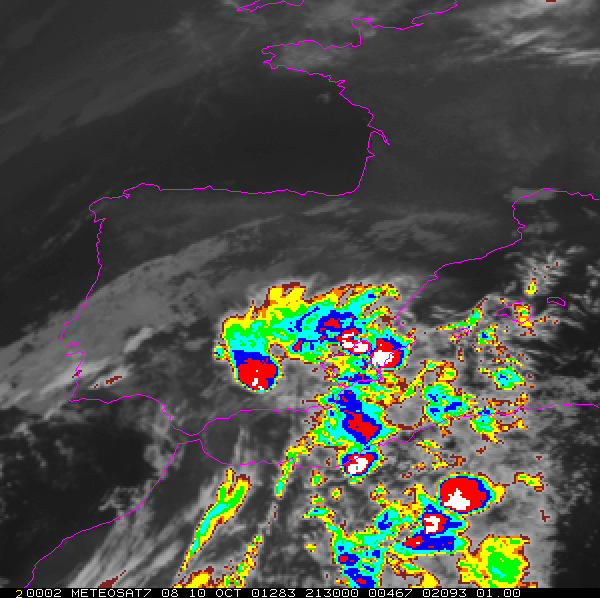
Figure 17: MSLP and 24-hour accumulated precipitation at 30-hour forecast
of the experiment REF (top) and the image of satellite at 21:30
UTC (bottom).
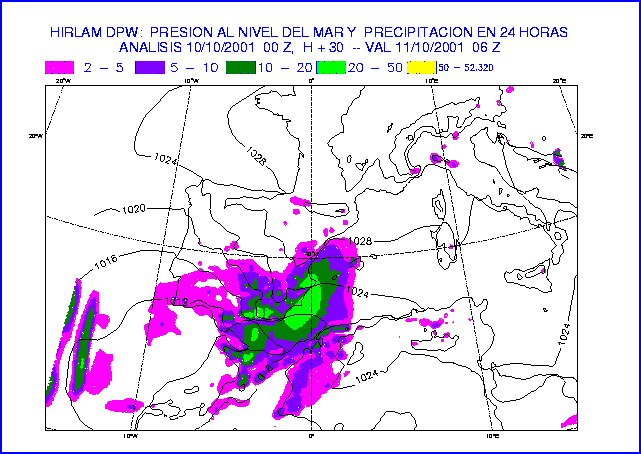
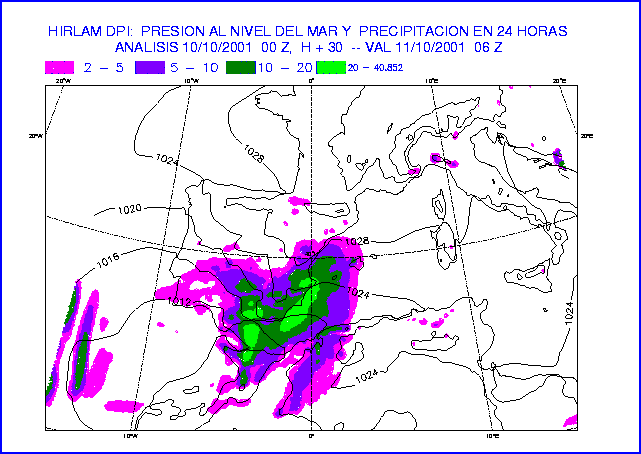
Figure 18: MSLP and 24-hour accumulated precipitation at 30-hour forecast
of the experiments DPW (top) and DPI (bottom).
Conclusions
In summary, both new methods lead to:
-
more stable results, with the possibility to increase the time-step;
-
more accurate results for a similar length of the time-step; and
-
a smoothing of the fields, especially precipitation.
It must be stressed that:
-
However, of the two new methods, perhaps introducing the radiation and
convection tendencies of the previous time-step and interpolated at the
departure point in the semi-implicit adjustment, we could achieve better
results in the estimation of diabatic tendencies due to vertical diffusion.
-
The forecast skill improvement of the new methods is small in the short
range, but becomes more appreciable in the medium range.
Current Work
Following the Wedi's approach:
1) In the experiment DPX, the contributions of the radiation,
convection and vertical diffusion schemes are averaged along the semi-Lagrangian
trajectory for all equations.
The final equation is:
| yn+1I
- yn+1D
= |
Dt+
2 |
[ Pn+1rad+conv+vdif]I+ |
Dt-
2 |
[ Pnrad+conv+vdif]* |
|
(13) |
2) In the experiment DPA, the contributions of the radiation,
convection and vertical diffusion schemes are averaged along the semi-Lagrangian
trajectory only for the temperature, specific humidity and cloud water
content equations.
In both experiments, a "first guess" predictor is employed by using
the tendency from the dynamics, the tendency of the radiation, convection
and vertical diffusion at the previous time-step.
| yn+1predict
= yn+1D
+ aPn*,rad+conv+vdif
Dt |
|
(14) |
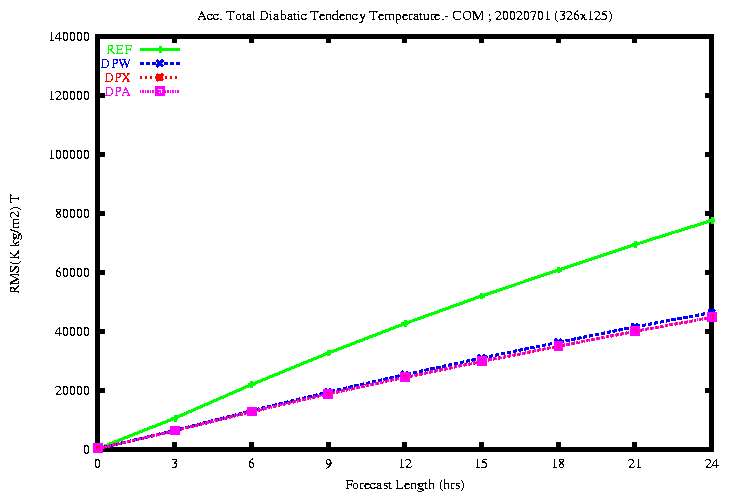
Figure 19: RMSE of the accumulated total diabatic tendency of temperature
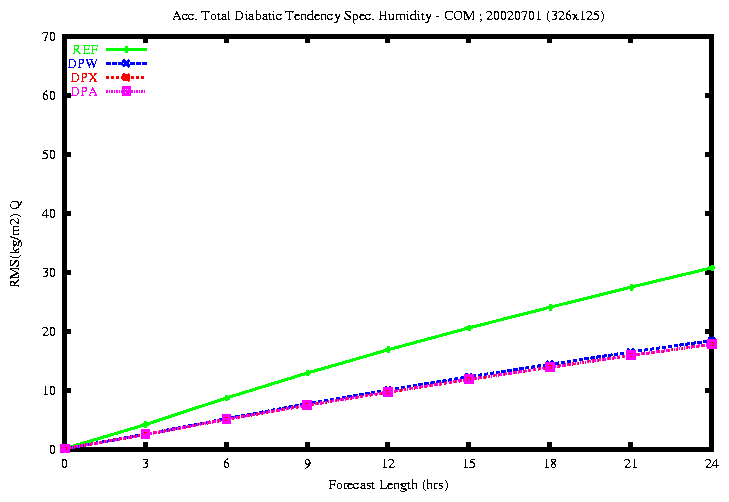
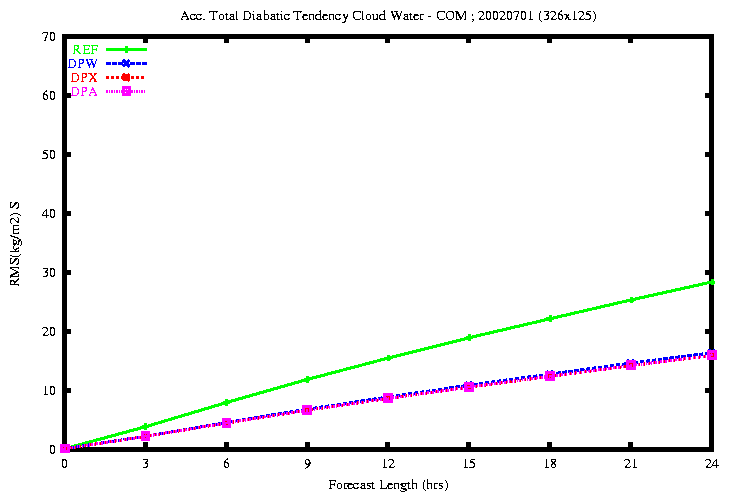
Figure 20: RMSE of the accumulated total diabatic tendency of Specific
Humidity (top) and Cloud Water Content (bottom)
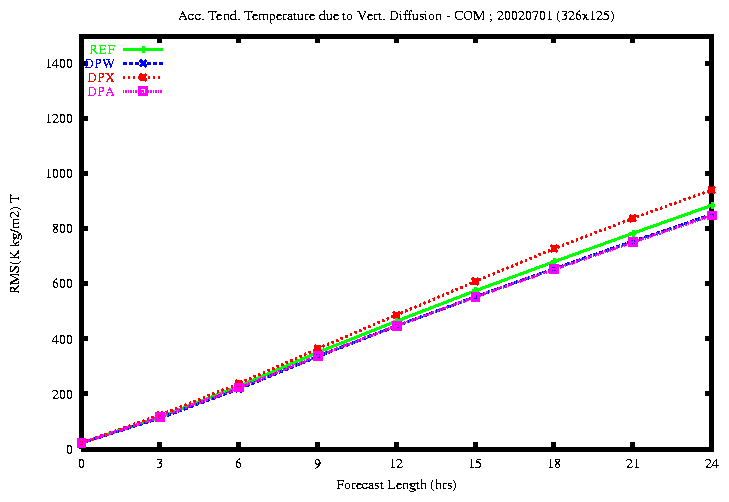
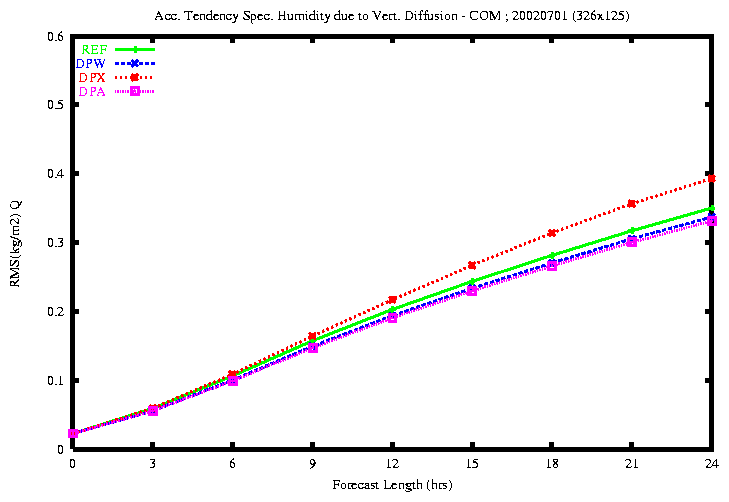
Figure 21: RMSE of the accumulated diabatic tendency of temperature
(top) and specific humidity due to Vert. Diffusion (bottom)
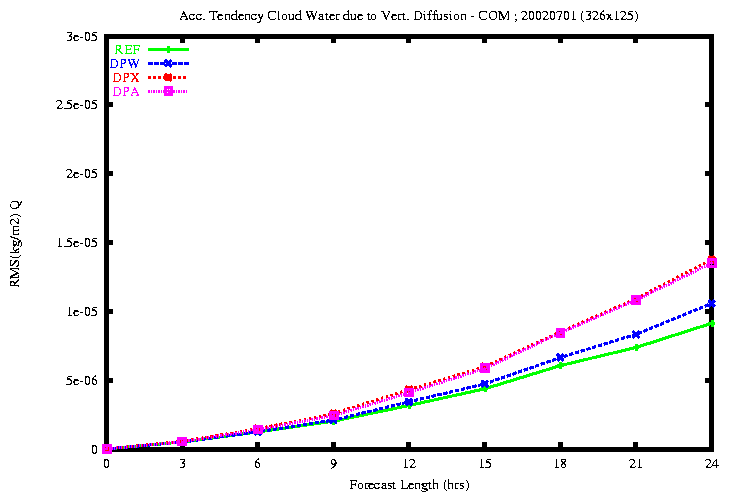
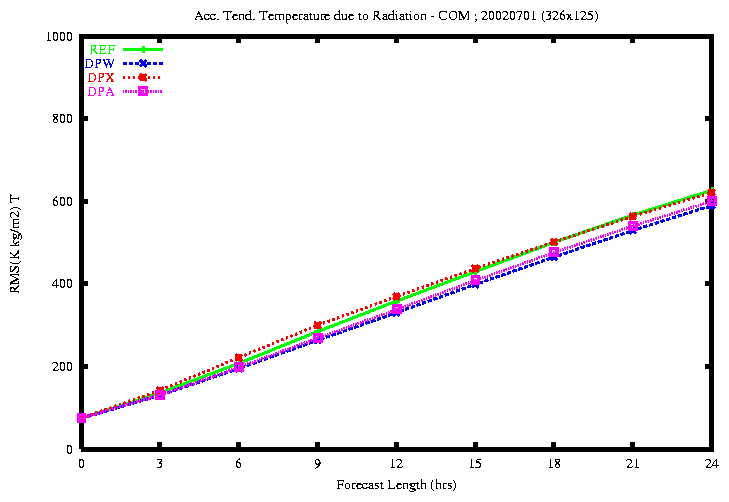
Figure 22: RMSE of the accumulated diabatic tendency of cloud water
content due to vert. diff. (top) and of temperature due to radiation (bottom)
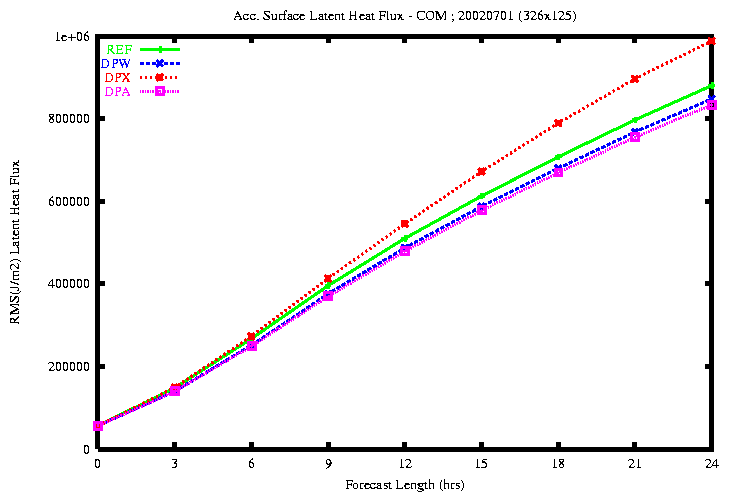
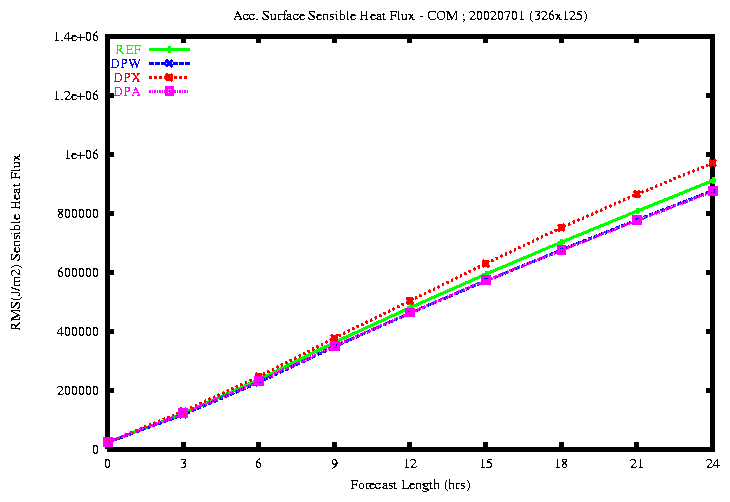
Figure 23: RMSE of the accumulated Surface Latent Flux (top) and Sensible
Flux (bottom)
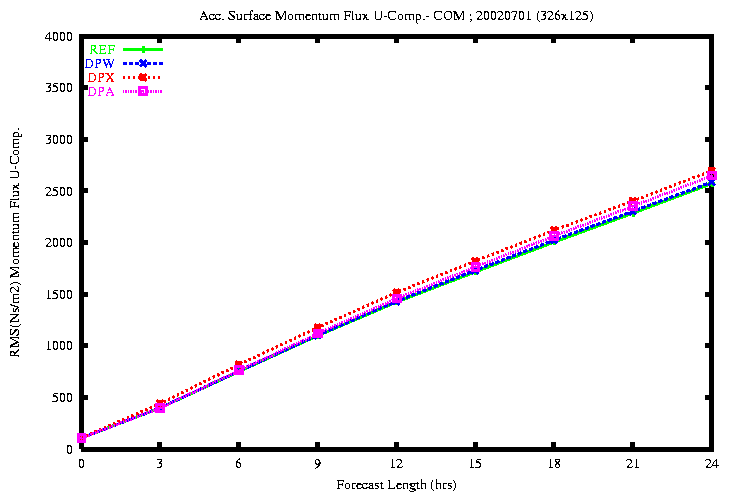
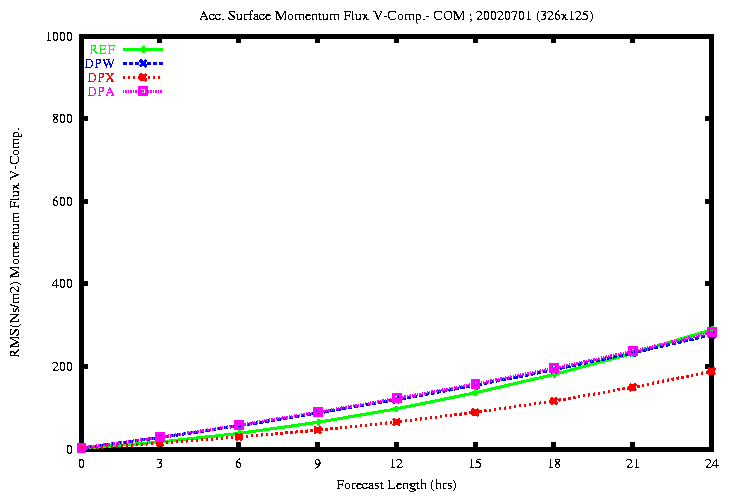
Figure 24: RMSE of the accumulated Momentum U Flux (top) and V Flux
(bottom)
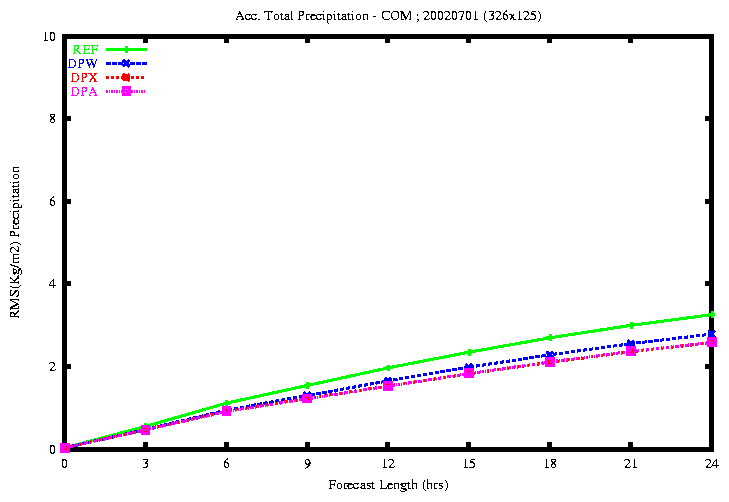
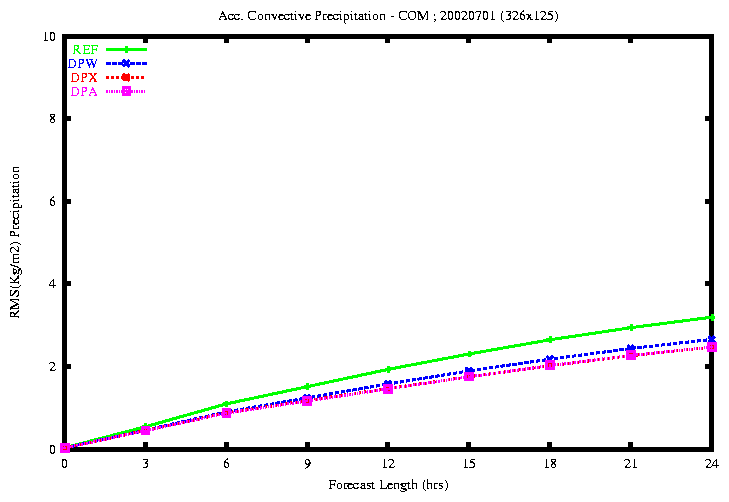
Figure 25: RMSE of the accumulated total Precipitation (top) and Convective
Precip. (bottom)
By comparing the four experiments REF, DPW, DPX
and DPA, I have found that:
-
the rmse of the total diabatic tendencies of temperature, specific
humidity and cloud water content is smaller with the experiments DPX
and DPA.
-
the rmse of the diabatic tendency of temperature due to Radiation
is smaller with the experiments DPW and DPA.
-
the rmse of the diabatic tendency of temperature due to Vertical
Diffusion is smaller with the experiments DPW and DPA and
is greater with the experiment DPX.
-
the rmse of the diabatic tendency of specific humidity due to Vertical
Diffusion is smaller with the experiment DPA and is greater with
the experiment DPX.
-
the rmse of the diabatic tendency of cloud water content due to
Vertical Diffusion is closer to zero and the results are contradictory.
-
the rmse of the surface latent and sensible fluxes is smaller with
the experiment DPA.
-
the rmse of the surface momentum U flux is similar in all experiments.
-
the rmse of the surface momentum V flux is smaller with the experiment
DPX.
-
the rmse of the total precipitation is smaller with the experiments
DPX and DPA.
-
the rmse of the convective precipitation is smaller with the experiments
DPX and DPA.
It must be stressed that:
-
When the contributions of the vertical diffusion are averaged along the
semi-Lagrangian trajectory in all equations, the results of the diabatic
tendencies due to vertical diffusion are deteriorated.
-
However, the best results are obtained when vertical diffusion tendencies
are averaged along the semi-Lagrangian trajectory only for the temperature,
specific humidity and cloud water content equations and not for the wind
component equations.
-
It seems that the problem is related with the averaging of vertical diffusion
tendencies in the wind component equations.
Future Work
The radiation, convection and vertical diffusion tendencies of the previous
time-step and interpolated at the departure point will be introduced in
the semi-implicit adjustment.
The discretized resulting equation is:
|
|
|
|
Dt+
2 |
[ Ln+1 + Nn+[1/2]
]I |
|
(15) |
|
|
|
Dt-
2 |
[ Ln + Nn+[1/2]
+ Pnrad+conv+vdif]* |
|
(16) |
|
|
|
The first-guess predictor equation could be:
| yn+1predict
= yn+1D
+ aPn*,rad+conv+vdif
Dt |
|
(17) |
And the final equation will be:
| yn+1I
- |
~
y
|
n+1
I |
= |
Dt+
2 |
[ Pn+1rad+conv+vdif]I |
|
(18) |
File translated from TEX by TTH,
version 2.34.
On 10 Dec 2002, 11:13.